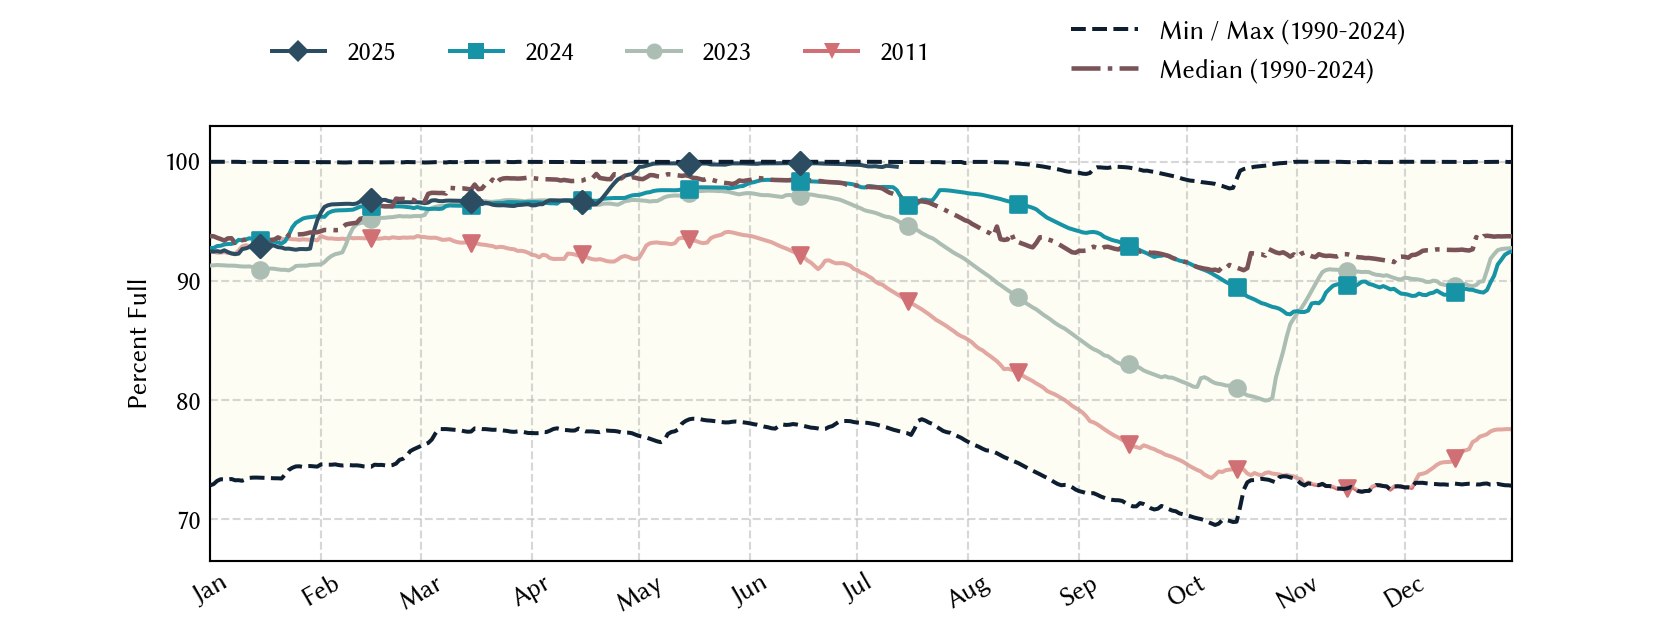
Trinity River Basin Reservoirs: Monitored Water Supply Reservoirs are 99.7% full on 2025-07-02


Historical Data
| Date | Percent Full |
Reservoir Storage (acre-ft) |
Conservation Storage (acre-ft) |
Conservation Capacity (acre-ft) |
|
|---|---|---|---|---|---|
| Most recent | 2025-07-02 | 99.7 | 6,938,048 | 6,758,539 | 6,776,855 |
| 1 day prior | 2025-07-01 | 99.7 | 6,951,944 | 6,759,700 | 6,776,855 |
| 2 days prior | 2025-06-30 | 99.7 | 6,969,137 | 6,759,776 | 6,776,855 |
| 1 week prior | 2025-06-25 | 99.8 | 7,181,254 | 6,764,517 | 6,776,855 |
| 1 month prior | 2025-06-02 | 99.8 | 7,192,047 | 6,765,550 | 6,776,855 |
| 3 months prior | 2025-04-02 | 96.3 | 6,645,005 | 6,529,430 | 6,776,855 |
| 6 months prior | 2025-01-02 | 92.5 | 6,400,223 | 6,266,242 | 6,776,855 |
| 1 year prior | 2024-07-02 | 97.9 | 7,356,354 | 6,632,233 | 6,776,855 |
*
Percent Full is based on Conservation Storage and Conservation Capacity and doesn't account for storage in flood pool.
Area Map

Reservoir Storage
| Reservoir | Type | Percent Full |
Water Level (ft) |
Height Above Conservation Pool (ft) |
Reservoir Storage (acre-ft) |
Conservation Storage (acre-ft) |
Conservation Capacity (acre-ft) |
Surface Area (acres) |
|---|---|---|---|---|---|---|---|---|
| Amon G Carter |

|
100.0 | 920.92 | 0.92 | 21,502 | 19,266 | 19,266 | 1,551 |
| Arlington |
|
93.2 | 548.57 | -1.43 | 37,465 | 37,433 | 40,157 | 1,888 |
| Bardwell |

|
100.0 | 423.37 | 2.37 | 52,100 | 43,856 | 43,856 | 3,622 |
| Benbrook |
|
99.8 | 693.96 | -0.04 | 85,501 | 85,501 | 85,648 | 3,631 |
| Bridgeport |
|
99.9 | 835.96 | -0.04 | 371,690 | 371,690 | 372,183 | 12,327 |
| Cedar Creek |
|
99.5 | 321.90 | -0.10 | 641,515 | 641,416 | 644,686 | 32,616 |
| Eagle Mountain |
|
100.0 | 649.30 | 0.20 | 186,942 | 185,087 | 185,087 | 9,311 |
| Grapevine |
|
100.0 | 537.51 | 2.51 | 180,394 | 163,064 | 163,064 | - n.a. - |
| Halbert |
|
87.1 | 366.61 | -1.39 | 5,252 | 5,252 | 6,033 | 546 |
| Houston County |
|
100.0 | 260.18 | 0.18 | 17,898 | 17,113 | 17,113 | - n.a. - |
| Joe Pool |
|
100.0 | 522.63 | 0.63 | 155,260 | 149,629 | 149,629 | 6,827 |
| Lavon |
|
100.0 | 492.63 | 0.63 | 425,716 | 409,757 | 409,757 | 20,983 |
| Lewisville |
|
100.0 | 522.56 | 0.56 | 614,136 | 563,228 | 563,228 | - n.a. - |
| Livingston |
|
100.0 | 131.02 | 0.02 | 1,605,059 | 1,603,504 | 1,603,504 | 77,812 |
| Lost Creek |
|
98.5 | 1,009.08 | -0.42 | 11,774 | 11,774 | 11,950 | - n.a. - |
| Mountain Creek |
|
100.0 | 457.77 | 0.77 | 24,956 | 22,850 | 22,850 | 2,926 |
| Navarro Mills |
|
100.0 | 428.38 | 3.88 | 69,563 | 49,827 | 49,827 | - n.a. - |
| New Terrell City |
|
30.6 | 494.83 | -9.17 | 2,634 | 2,623 | 8,583 | 409 |
| Ray Hubbard |
|
99.4 | 435.38 | -0.12 | 437,055 | 437,055 | 439,559 | 20,798 |
| Ray Roberts |
|
100.0 | 632.80 | 0.30 | 797,027 | 788,167 | 788,167 | - n.a. - |
| Richland-Chambers |
|
100.0 | 315.12 | 0.12 | 1,130,471 | 1,099,417 | 1,099,417 | - n.a. - |
| Waxahachie |
|
100.0 | 531.82 | 0.32 | 11,856 | 11,060 | 11,060 | 679 |
| Weatherford |
|
82.6 | 893.00 | -3.00 | 14,707 | 14,707 | 17,812 | 987 |
| Worth |
|
99.0 | 593.93 | -0.07 | 33,256 | 24,180 | 24,419 | 3,428 |