Low-Rolling-Plains Climate Division Reservoirs: Monitored Water Supply Reservoirs are 72.6% full on 2025-06-23


Historical Data
| Date | Percent Full |
Reservoir Storage (acre-ft) |
Conservation Storage (acre-ft) |
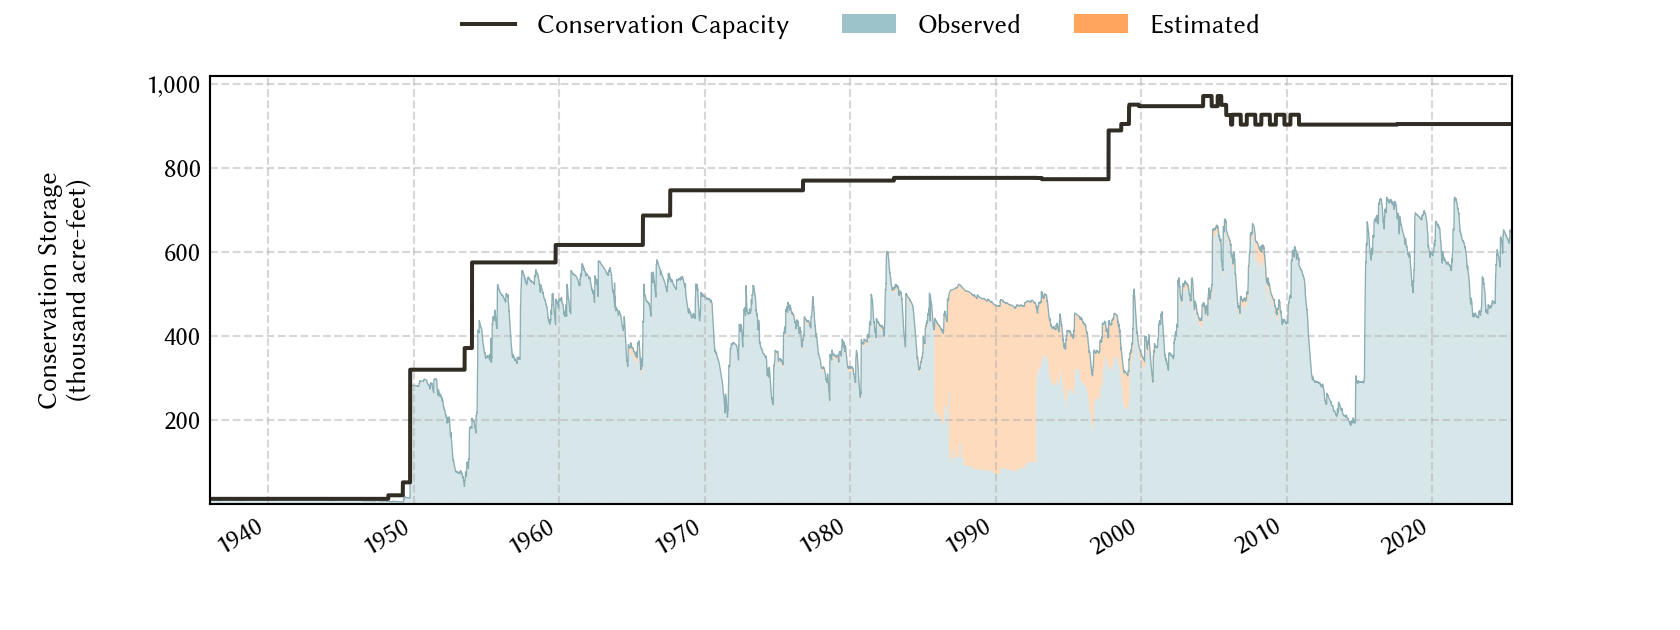
Conservation Capacity (acre-ft) |
|
|---|---|---|---|---|---|
| Today | 2025-06-23 | 72.6 | 707,600 | 656,001 | 903,870 |
| Yesterday | 2025-06-22 | 72.6 | 711,039 | 656,565 | 903,870 |
| 2 days ago | 2025-06-21 | 72.7 | 716,408 | 657,445 | 903,870 |
| 1 week ago | 2025-06-16 | 73.1 | 730,529 | 660,400 | 903,870 |
| 1 month ago | 2025-05-23 | 71.5 | 706,728 | 646,388 | 903,870 |
| 3 months ago | 2025-03-23 | 69.1 | 631,235 | 624,386 | 903,870 |
| 6 months ago | 2024-12-23 | 71.5 | 657,150 | 646,270 | 903,870 |
| 1 year ago | 2024-06-23 | 66.6 | 677,261 | 601,989 | 903,870 |
*
Percent Full is based on Conservation Storage and Conservation Capacity and doesn't account for storage in flood pool.
Area Map

Reservoir Storage
| Reservoir | Type | Percent Full |
Water Level (ft) |
Height Above Conservation Pool (ft) |
Reservoir Storage (acre-ft) |
Conservation Storage (acre-ft) |
Conservation Capacity (acre-ft) |
Surface Area (acres) |
|---|---|---|---|---|---|---|---|---|
| Abilene |

|
5.5 | 1,989.98 | -22.32 | 432 | 432 | 7,900 | 114 |
| Alan Henry |
|
97.6 | 2,219.17 | -0.83 | 93,907 | 93,907 | 96,207 | 2,742 |
| Champion Creek |
|
47.1 | 2,064.60 | -18.40 | 19,564 | 19,564 | 41,580 | 912 |
| Coleman |
|
98.2 | 1,717.12 | -0.38 | 37,408 | 37,390 | 38,075 | 1,799 |
| Colorado City |
|
65.6 | 2,062.16 | -8.04 | 20,180 | 20,180 | 30,758 | - n.a. - |
| Fort Phantom Hill |
|
84.8 | 1,633.02 | -2.88 | 59,382 | 59,376 | 70,030 | 3,488 |
| Greenbelt |
|
10.0 | 2,616.23 | -47.77 | 6,452 | 6,020 | 59,968 | 433 |
| Hords Creek |

|
69.3 | 1,894.35 | -5.65 | 5,626 | 5,623 | 8,109 | 380 |
| J B Thomas |
|
36.1 | 2,235.05 | -22.95 | 72,856 | 72,183 | 199,931 | 4,142 |
| Kemp |
|
100.0 | 1,146.66 | 2.66 | 287,868 | 245,307 | 245,307 | - n.a. - |
| Millers Creek |
|
93.7 | 1,333.22 | -0.78 | 26,362 | 25,079 | 26,768 | 2,120 |
| North Fork Buffalo Creek |
|
100.0 | 1,048.06 | 0.06 | 15,541 | 15,400 | 15,400 | 1,511 |
| Stamford |
|
100.0 | 1,418.25 | 1.45 | 58,052 | 51,570 | 51,570 | 5,544 |
| Sweetwater |
|
32.4 | 2,098.39 | -18.11 | 3,970 | 3,970 | 12,267 | 302 |