Brazos-G Planning Region Reservoirs: Monitored Water Supply Reservoirs are 93.5% full on 2025-06-15


Historical Data
| Date | Percent Full |
Reservoir Storage (acre-ft) |
Conservation Storage (acre-ft) |
Conservation Capacity (acre-ft) |
|
|---|---|---|---|---|---|
| Today | 2025-06-15 | 93.5 | 3,434,588 | 3,224,971 | 3,448,550 |
| Yesterday | 2025-06-14 | 93.5 | 3,435,000 | 3,224,192 | 3,448,550 |
| 2 days ago | 2025-06-13 | 93.5 | 3,419,040 | 3,226,047 | 3,448,550 |
| 1 week ago | 2025-06-08 | 92.8 | 3,276,137 | 3,200,169 | 3,448,550 |
| 1 month ago | 2025-05-15 | 91.9 | 3,205,781 | 3,169,393 | 3,448,550 |
| 3 months ago | 2025-03-15 | 89.2 | 3,095,125 | 3,076,702 | 3,448,550 |
| 6 months ago | 2024-12-15 | 89.1 | 3,084,216 | 3,071,046 | 3,448,550 |
| 1 year ago | 2024-06-15 | 93.0 | 3,704,367 | 3,205,945 | 3,448,550 |
*
Percent Full is based on Conservation Storage and Conservation Capacity and doesn't account for storage in flood pool.
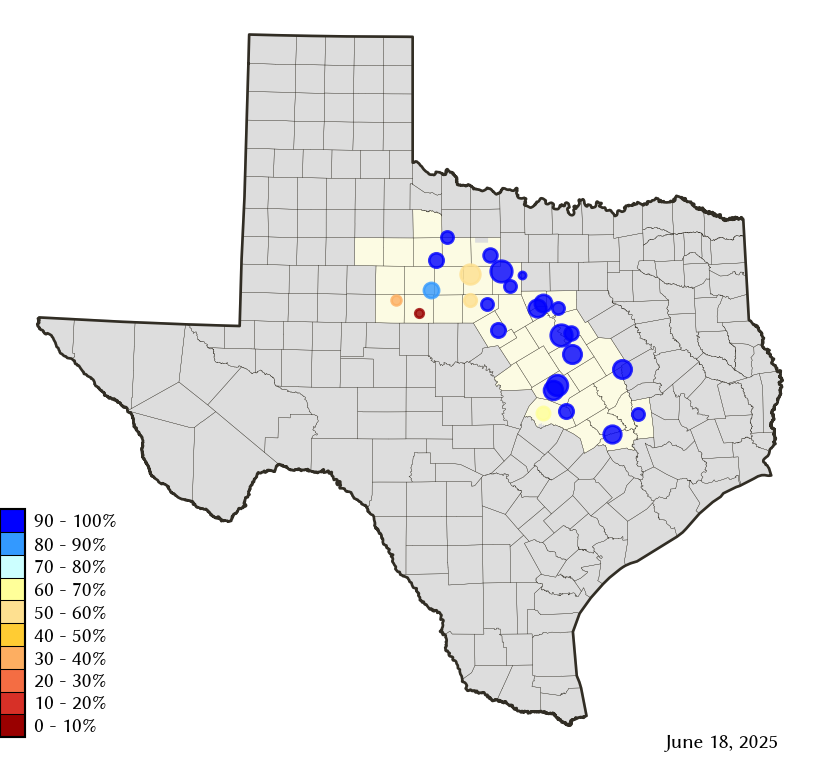
Area Map
Reservoir Storage
| Reservoir | Type | Percent Full |
Water Level (ft) |
Height Above Conservation Pool (ft) |
Reservoir Storage (acre-ft) |
Conservation Storage (acre-ft) |
Conservation Capacity (acre-ft) |
Surface Area (acres) |
|---|---|---|---|---|---|---|---|---|
| Abilene |

|
5.9 | 1,990.29 | -22.01 | 467 | 467 | 7,900 | 118 |
| Aquilla |

|
100.0 | 543.09 | 5.59 | 62,394 | 43,243 | 43,243 | - n.a. - |
| Belton |
|
100.0 | 597.61 | 3.61 | 479,266 | 432,631 | 432,631 | - n.a. - |
| Cisco |
|
57.3 | 1,509.47 | -12.99 | 16,612 | 16,612 | 29,003 | 725 |
| Comanche Creek |
|
100.0 | 775.72 | 0.72 | 153,564 | 151,250 | 151,250 | - n.a. - |
| Fort Phantom Hill |
|
85.8 | 1,633.23 | -2.67 | 60,118 | 60,112 | 70,030 | 3,516 |
| Georgetown |
|
69.4 | 781.12 | -9.88 | 26,449 | 26,386 | 38,005 | 1,047 |
| Gibbons Creek |
|
99.4 | 246.94 | -0.06 | 27,272 | 25,568 | 25,721 | 2,546 |
| Graham |
|
99.9 | 1,074.99 | -0.01 | 45,278 | 45,264 | 45,288 | 2,443 |
| Granbury |
|
98.1 | 692.39 | -0.31 | 131,342 | 130,433 | 132,949 | 8,059 |
| Granger |
|
100.0 | 505.09 | 1.09 | 56,427 | 51,822 | 51,822 | - n.a. - |
| Hubbard Creek |
|
52.9 | 1,171.89 | -11.42 | 170,627 | 165,751 | 313,298 | 10,337 |
| Leon |
|
100.0 | 1,375.12 | 0.12 | 28,253 | 27,762 | 27,762 | - n.a. - |
| Limestone |
|
100.0 | 363.08 | 0.08 | 204,774 | 203,780 | 203,780 | - n.a. - |
| Millers Creek |
|
94.6 | 1,333.34 | -0.66 | 26,617 | 25,334 | 26,768 | 2,135 |
| Mineral Wells |
|
100.0 | 863.48 | 0.48 | 5,500 | 5,273 | 5,273 | 480 |
| Palo Pinto |
|
100.0 | 867.31 | 0.31 | 27,828 | 26,766 | 26,766 | - n.a. - |
| Pat Cleburne |
|
100.0 | 734.14 | 0.64 | 27,017 | 26,008 | 26,008 | - n.a. - |
| Possum Kingdom |
|
97.5 | 998.23 | -0.77 | 524,483 | 524,483 | 538,139 | 17,561 |
| Proctor |
|
100.0 | 1,163.42 | 1.42 | 61,504 | 54,762 | 54,762 | - n.a. - |
| Somerville |
|
100.0 | 239.10 | 1.10 | 162,974 | 150,293 | 150,293 | - n.a. - |
| Stamford |
|
100.0 | 1,419.27 | 2.47 | 63,874 | 51,570 | 51,570 | 5,888 |
| Stillhouse Hollow |
|
96.3 | 620.66 | -1.34 | 221,395 | 221,309 | 229,796 | 6,241 |
| Sweetwater |
|
33.0 | 2,098.67 | -17.83 | 4,049 | 4,049 | 12,267 | 306 |
| Waco |
|
100.0 | 464.58 | 2.38 | 209,444 | 189,418 | 189,418 | - n.a. - |
| Whitney |
|
100.0 | 535.86 | 2.86 | 636,335 | 564,808 | 564,808 | - n.a. - |