South-Central Climate Division Reservoirs: Monitored Water Supply Reservoirs are 44.2% full on 2025-06-07


Historical Data
| Date | Percent Full |
Reservoir Storage (acre-ft) |
Conservation Storage (acre-ft) |
Conservation Capacity (acre-ft) |
|
|---|---|---|---|---|---|
| Today | 2025-06-07 | 44.2 | 881,271 | 857,062 | 1,936,953 |
| Yesterday | 2025-06-06 | 44.1 | 879,471 | 855,147 | 1,936,953 |
| 2 days ago | 2025-06-05 | 44.0 | 877,031 | 852,822 | 1,936,953 |
| 1 week ago | 2025-05-31 | 44.2 | 879,465 | 855,718 | 1,936,953 |
| 1 month ago | 2025-05-07 | 43.3 | 856,090 | 838,378 | 1,936,953 |
| 3 months ago | 2025-03-07 | 43.4 | 857,484 | 839,772 | 1,936,953 |
| 6 months ago | 2024-12-07 | 44.3 | 875,358 | 857,646 | 1,936,953 |
| 1 year ago | 2024-06-07 | 45.3 | 908,951 | 877,256 | 1,936,953 |
*
Percent Full is based on Conservation Storage and Conservation Capacity and doesn't account for storage in flood pool.
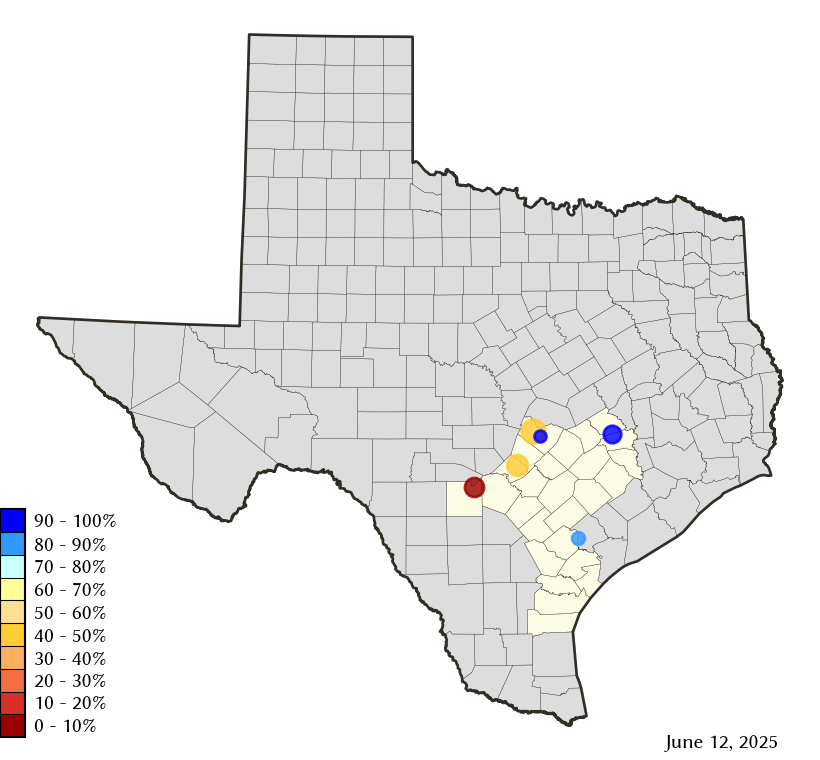
Area Map
Reservoir Storage
| Reservoir | Type | Percent Full |
Water Level (ft) |
Height Above Conservation Pool (ft) |
Reservoir Storage (acre-ft) |
Conservation Storage (acre-ft) |
Conservation Capacity (acre-ft) |
Surface Area (acres) |
|---|---|---|---|---|---|---|---|---|
| Austin |

|
95.8 | 492.15 | -0.65 | 23,566 | 22,957 | 23,972 | 1,542 |
| Canyon |

|
45.4 | 877.21 | -31.79 | 172,214 | 172,143 | 378,781 | 4,928 |
| Coleto Creek |
|
88.4 | 96.48 | -1.52 | 27,426 | 27,426 | 31,040 | 2,439 |
| Medina |
|
2.1 | 969.78 | -94.42 | 5,430 | 5,430 | 254,823 | 524 |
| Somerville |
|
100.0 | 238.57 | 0.57 | 156,790 | 150,293 | 150,293 | - n.a. - |
| Travis |
|
43.6 | 637.65 | -43.35 | 495,845 | 478,813 | 1,098,044 | 10,271 |