Lower-Colorado Planning Region Reservoirs: Monitored Water Supply Reservoirs are 51.0% full on 2025-05-18

Historical Data
| Date | Percent Full |
Reservoir Storage (acre-ft) |
Conservation Storage (acre-ft) |
Conservation Capacity (acre-ft) |
|
|---|---|---|---|---|---|
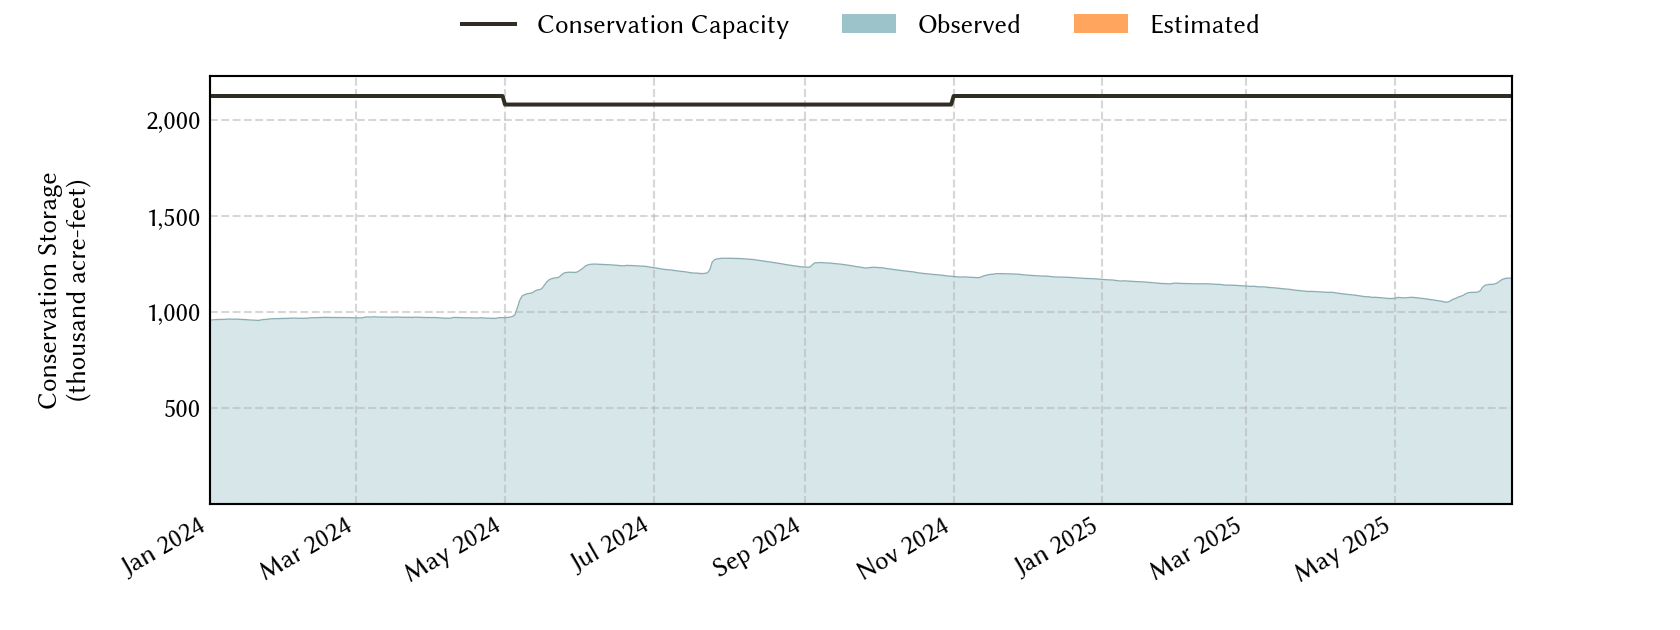
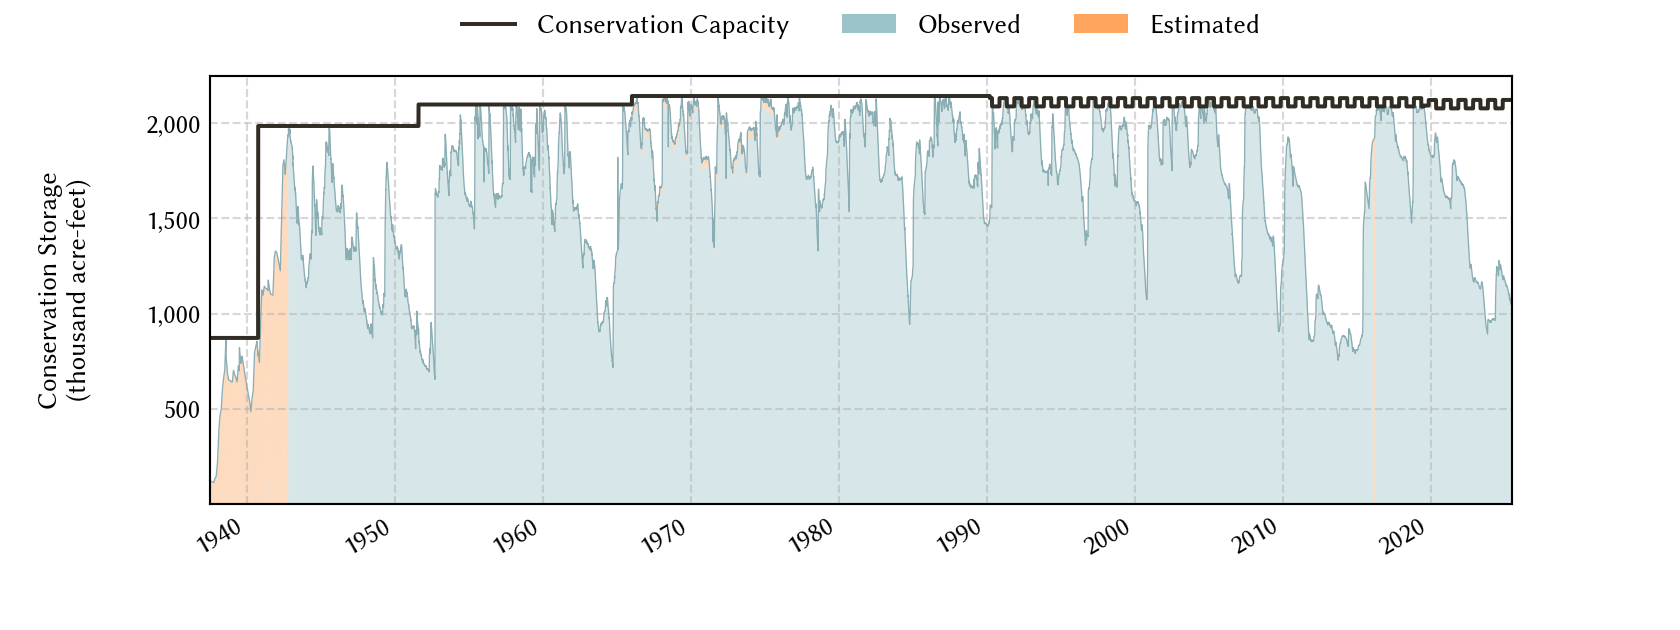
| Most recent | 2025-05-18 | 51.0 | 1,111,124 | 1,060,698 | 2,078,327 |
| 1 day prior | 2025-05-17 | 51.1 | 1,112,218 | 1,061,792 | 2,078,327 |
| 2 days prior | 2025-05-16 | 51.1 | 1,113,282 | 1,062,856 | 2,078,327 |
| 1 week prior | 2025-05-11 | 51.6 | 1,122,060 | 1,071,634 | 2,078,327 |
| 1 month prior | 2025-04-18 | 50.9 | 1,130,307 | 1,079,881 | 2,122,814 |
| 3 months prior | 2025-02-18 | 53.8 | 1,193,241 | 1,142,815 | 2,122,814 |
| 6 months prior | 2024-11-18 | 56.4 | 1,247,940 | 1,197,514 | 2,122,814 |
| 1 year prior | 2024-05-18 | 55.5 | 1,204,316 | 1,153,890 | 2,078,327 |
*
Percent Full is based on Conservation Storage and Conservation Capacity and doesn't account for storage in flood pool.
Area Map

Reservoir Storage
| Reservoir | Type | Percent Full |
Water Level (ft) |
Height Above Conservation Pool (ft) |
Reservoir Storage (acre-ft) |
Conservation Storage (acre-ft) |
Conservation Capacity (acre-ft) |
Surface Area (acres) |
|---|---|---|---|---|---|---|---|---|
| Austin |

|
95.6 | 492.12 | -0.68 | 23,520 | 22,911 | 23,972 | 1,541 |
| Buchanan |
|
54.5 | 998.18 | -19.82 | 462,098 | 448,436 | 822,207 | 15,084 |
| Inks |
|
94.7 | 887.09 | -0.91 | 13,288 | 13,005 | 13,729 | 781 |
| Lyndon B Johnson |
|
98.2 | 824.68 | -0.32 | 129,564 | 110,724 | 112,778 | 6,402 |
| Marble Falls |
|
95.5 | 736.44 | -0.56 | 7,257 | 7,257 | 7,597 | 602 |
| Travis |

|
41.7 | 635.63 | -45.37 | 475,397 | 458,365 | 1,098,044 | 9,976 |