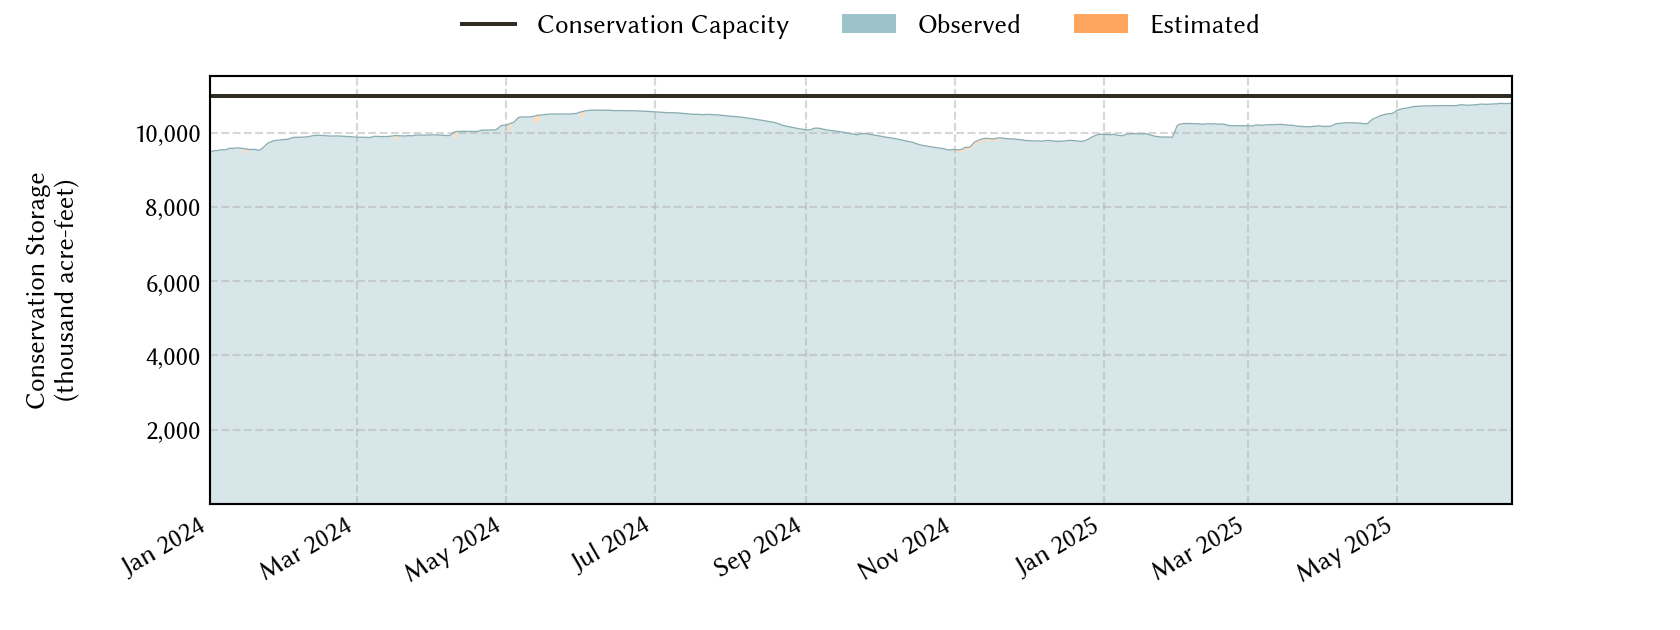
North-Central Climate Division Reservoirs: Monitored Water Supply Reservoirs are 98.1% full on 2025-06-16


Historical Data
| Date | Percent Full |
Reservoir Storage (acre-ft) |
Conservation Storage (acre-ft) |
Conservation Capacity (acre-ft) |
|
|---|---|---|---|---|---|
| Today | 2025-06-16 | 98.1 | 13,814,831 | 10,781,128 | 10,984,350 |
| Yesterday | 2025-06-15 | 98.2 | 13,828,531 | 10,781,373 | 10,984,350 |
| 2 days ago | 2025-06-14 | 98.1 | 13,855,664 | 10,779,527 | 10,984,350 |
| 1 week ago | 2025-06-09 | 98.0 | 13,528,539 | 10,770,004 | 10,984,350 |
| 1 month ago | 2025-05-16 | 97.6 | 14,185,143 | 10,723,762 | 10,984,350 |
| 3 months ago | 2025-03-16 | 93.0 | 11,539,691 | 10,210,171 | 10,984,350 |
| 6 months ago | 2024-12-16 | 89.0 | 11,206,583 | 9,773,675 | 10,984,350 |
| 1 year ago | 2024-06-16 | 96.4 | 13,993,604 | 10,592,627 | 10,984,350 |
*
Percent Full is based on Conservation Storage and Conservation Capacity and doesn't account for storage in flood pool.
Area Map
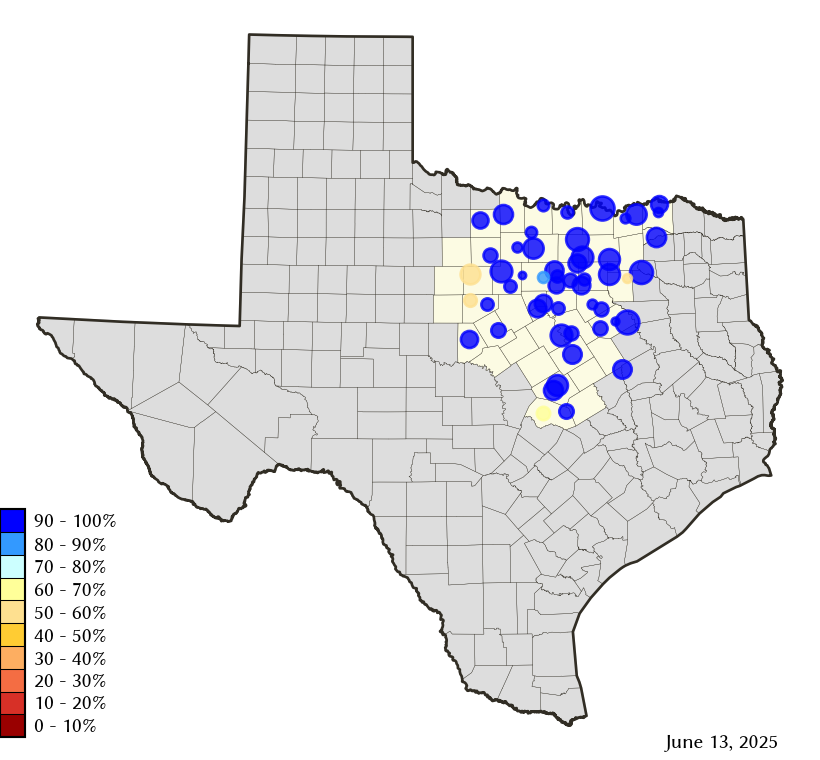
Reservoir Storage
| Reservoir | Type | Percent Full |
Water Level (ft) |
Height Above Conservation Pool (ft) |
Reservoir Storage (acre-ft) |
Conservation Storage (acre-ft) |
Conservation Capacity (acre-ft) |
Surface Area (acres) |
|---|---|---|---|---|---|---|---|---|
| Amon G Carter |

|
100.0 | 922.60 | 2.60 | 24,467 | 19,266 | 19,266 | 1,670 |
| Aquilla |

|
100.0 | 542.86 | 5.36 | 61,534 | 43,243 | 43,243 | - n.a. - |
| Arlington |
|
100.0 | 550.30 | 0.30 | 40,766 | 40,157 | 40,157 | - n.a. - |
| Arrowhead |
|
100.0 | 926.06 | 0.06 | 231,231 | 230,359 | 230,359 | - n.a. - |
| Bardwell |
|
100.0 | 426.33 | 5.33 | 63,413 | 43,856 | 43,856 | 3,997 |
| Belton |
|
100.0 | 597.69 | 3.69 | 480,338 | 432,631 | 432,631 | - n.a. - |
| Benbrook |
|
100.0 | 696.15 | 2.15 | 93,925 | 85,648 | 85,648 | - n.a. - |
| Bois d'Arc |
|
100.0 | 535.32 | 1.32 | 390,074 | 367,609 | 367,609 | 17,128 |
| Bonham |
|
100.0 | 565.14 | 0.14 | 11,189 | 11,027 | 11,027 | 1,077 |
| Bridgeport |
|
100.0 | 836.70 | 0.70 | 381,079 | 372,183 | 372,183 | 12,680 |
| Brownwood |
|
100.0 | 1,425.06 | 0.46 | 131,939 | 130,868 | 130,868 | 6,826 |
| Cisco |
|
57.3 | 1,509.48 | -12.98 | 16,619 | 16,619 | 29,003 | 725 |
| Comanche Creek |
|
100.0 | 775.69 | 0.69 | 153,468 | 151,250 | 151,250 | - n.a. - |
| Crook |
|
100.0 | 476.16 | 0.16 | 9,379 | 9,195 | 9,195 | - n.a. - |
| Eagle Mountain |
|
100.0 | 649.55 | 0.45 | 189,281 | 185,087 | 185,087 | - n.a. - |
| Georgetown |
|
69.8 | 781.25 | -9.75 | 26,585 | 26,522 | 38,005 | 1,050 |
| Graham |
|
100.0 | 1,075.05 | 0.05 | 45,426 | 45,288 | 45,288 | - n.a. - |
| Granbury |
|
98.7 | 692.49 | -0.21 | 132,150 | 131,241 | 132,949 | 8,096 |
| Granger |
|
100.0 | 505.12 | 1.12 | 56,558 | 51,822 | 51,822 | - n.a. - |
| Grapevine |
|
100.0 | 540.47 | 5.47 | 202,822 | 163,064 | 163,064 | - n.a. - |
| Halbert |
|
92.9 | 367.25 | -0.75 | 5,606 | 5,606 | 6,033 | 560 |
| Hubbard Creek |
|
53.0 | 1,171.93 | -11.38 | 171,041 | 166,165 | 313,298 | 10,354 |
| Hubert H Moss |
|
100.0 | 715.83 | 0.83 | 25,060 | 24,058 | 24,058 | - n.a. - |
| Jim Chapman |
|
100.0 | 443.22 | 3.22 | 355,507 | 258,723 | 258,723 | 19,882 |
| Joe Pool |
|
100.0 | 524.56 | 2.56 | 168,844 | 149,629 | 149,629 | 7,250 |
| Kickapoo |
|
100.0 | 1,045.42 | 0.42 | 88,828 | 86,345 | 86,345 | - n.a. - |
| Lavon |
|
100.0 | 495.74 | 3.74 | 494,450 | 409,757 | 409,757 | 23,582 |
| Leon |
|
100.0 | 1,375.11 | 0.11 | 28,236 | 27,762 | 27,762 | - n.a. - |
| Lewisville |
|
100.0 | 524.44 | 2.44 | 666,880 | 563,228 | 563,228 | - n.a. - |
| Limestone |
|
100.0 | 363.09 | 0.09 | 204,898 | 203,780 | 203,780 | - n.a. - |
| Lost Creek |
|
100.0 | 1,009.62 | 0.12 | 12,000 | 11,950 | 11,950 | - n.a. - |
| Mineral Wells |
|
100.0 | 863.49 | 0.49 | 5,505 | 5,273 | 5,273 | 480 |
| Mountain Creek |
|
100.0 | 457.35 | 0.35 | 23,692 | 22,850 | 22,850 | 2,780 |
| Navarro Mills |
|
100.0 | 432.21 | 7.71 | 91,956 | 49,827 | 49,827 | - n.a. - |
| New Terrell City |
|
49.8 | 498.16 | -5.84 | 4,288 | 4,277 | 8,583 | 586 |
| Nocona |
|
100.0 | 829.05 | 1.55 | 23,870 | 21,444 | 21,444 | - n.a. - |
| Palo Pinto |
|
100.0 | 867.29 | 0.29 | 27,784 | 26,766 | 26,766 | - n.a. - |
| Pat Cleburne |
|
100.0 | 734.02 | 0.52 | 26,827 | 26,008 | 26,008 | - n.a. - |
| Pat Mayse |
|
100.0 | 454.63 | 3.63 | 139,021 | 113,683 | 113,683 | - n.a. - |
| Possum Kingdom |
|
97.3 | 998.17 | -0.83 | 523,430 | 523,430 | 538,139 | 17,534 |
| Proctor |
|
100.0 | 1,163.39 | 1.39 | 61,358 | 54,762 | 54,762 | - n.a. - |
| Ray Hubbard |
|
100.0 | 435.59 | 0.09 | 441,450 | 439,559 | 439,559 | 21,061 |
| Ray Roberts |
|
100.0 | 634.32 | 1.82 | 841,189 | 788,167 | 788,167 | - n.a. - |
| Richland-Chambers |
|
100.0 | 315.78 | 0.78 | 1,159,665 | 1,099,417 | 1,099,417 | - n.a. - |
| Stillhouse Hollow |
|
96.4 | 620.71 | -1.29 | 221,707 | 221,621 | 229,796 | 6,247 |
| Tawakoni |
|
100.0 | 439.52 | 2.02 | 948,589 | 871,685 | 871,685 | - n.a. - |
| Texoma 1 |
|
100.0 | 627.06 | 10.06 | 3,415,595 | 1,243,801 | 1,243,801 | 104,790 |
| Waco |
|
100.0 | 464.21 | 2.01 | 206,292 | 189,418 | 189,418 | - n.a. - |
| Waxahachie |
|
100.0 | 532.06 | 0.56 | 12,020 | 11,060 | 11,060 | 687 |
| Weatherford |
|
83.7 | 893.21 | -2.79 | 14,915 | 14,915 | 17,812 | 993 |
| Whitney |
|
100.0 | 535.54 | 2.54 | 628,109 | 564,808 | 564,808 | - n.a. - |
| Worth |
|
100.0 | 594.14 | 0.14 | 33,976 | 24,419 | 24,419 | - n.a. - |
footnotes
1
Lake Texoma straddles the border of Texas and Oklahoma, Texas has rights to 50% of Lake Texoma's total conservation capacity. Percent full, conservation storage and conservation capacity are based on the Texas share.